Need Help? Call Now
1-800-952-8444Free Consultation
Need Help? Call Now
1-800-952-8444Posted on April 15, 2024
The cost of healthcare in the United States continues to be a pressing concern that affects millions of individuals across the nation. In fact, more than 100 million Americans carry healthcare-related debt, according to the Kaiser Family Foundation. So how much does the average American spend on health-related expenses out of pocket?
We surveyed over 2,000 Americans to find out. We asked about their average annual spend on both medical expenses (such as doctor’s appointments, dental checkups, prescriptions, etc.) and everyday expenses (including over-the-counter medications). We also asked a variety of related questions including, perceptions towards healthcare and how demographic characteristics impact priorities. From there, we mapped out which U.S. states are spending the most and least on their well-being, and other key insights associated with healthcare spending.
Read on to see what we found.
When we looked into which U.S. states spend the most and least on healthcare each year, we found some interesting differences. We compared these to the national average, which is about $2,456.42 that people pay from their own pockets for healthcare every year.
Maryland spends the most on healthcare, with people paying $6,426.57 on average each year — with over $5,000 going towards medical-related expenses alone. This means folks in Maryland are spending a significant amount more than most people in the U.S. to stay healthy.
Delaware is next, where people spend $3,481.42 per year on healthcare. That’s a lot of money, showing that people in Delaware also pay a lot to take care of their health.
Continuing, Nebraska, Missouri, and Illinois are among the states where people spend the most on healthcare each year. Those in Nebraska spend $3,318.06, making it the third highest in healthcare expenses. Missouri is close behind with an annual spend of $3,294.85, ranking fourth, while Illinois rounds out the top five with people spending $3,281.64 on their health needs.
But not all states spend so much. Hawaii spends the least, with people only paying $1,036.24 on average per year. That’s substantially less than the national average and the lowest in the U.S. The average Hawaiian spends just around $700 on medical expenses and $25 on everyday health essentials each year.
Ohio is next from the bottom, where people spend $1,464.51 per year. Similarly, Arkansas residents spend an average of $1,599.69 on average each year, coming in as third lowest in the nation. Rounding out the bottom five is Oklahoma and Florida, with residents in each state budgeting less than $2,000 for health care on average in a year.
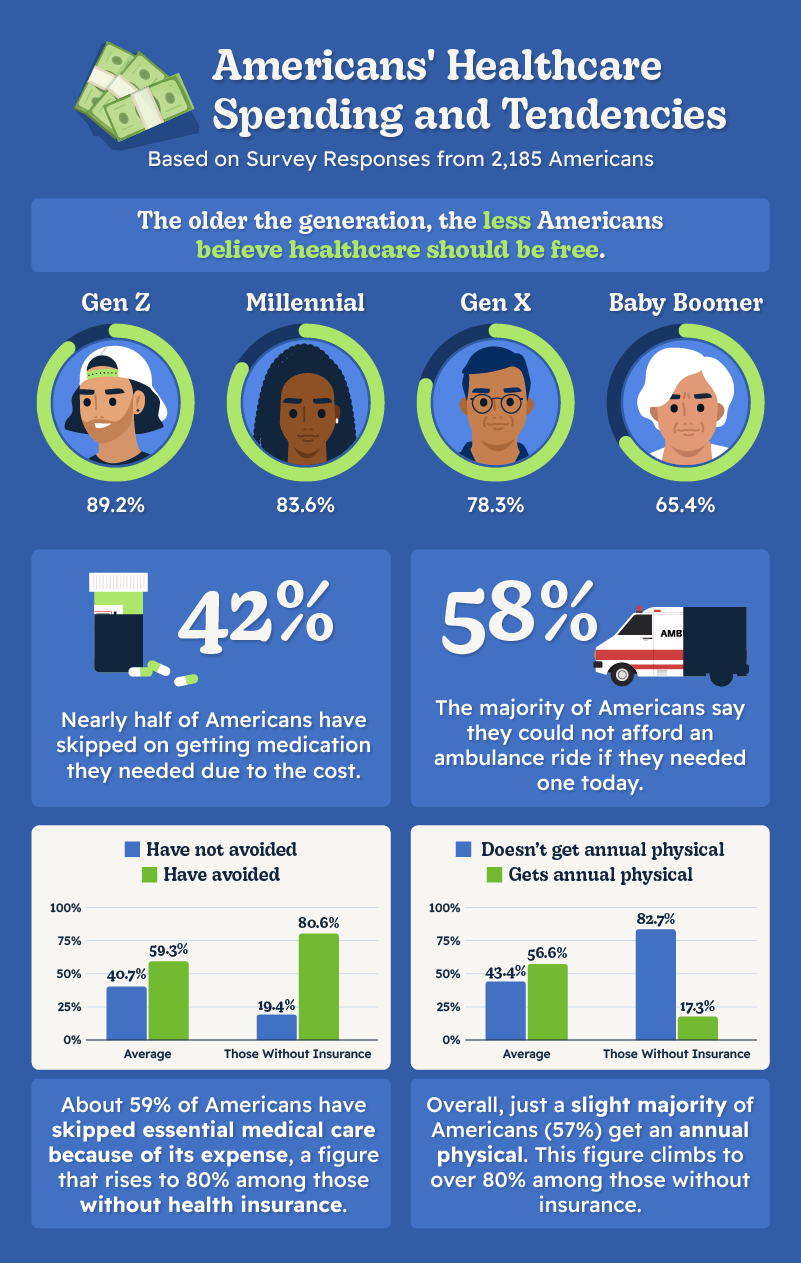
Zooming out, we next wanted to analyze the beliefs, behaviors, and preferences of Americans when it comes to healthcare. A vast majority, 81% of Americans, believe healthcare should be free, but this sentiment isn’t uniformly shared across all demographics. Only 65% of Baby Boomers share this belief, indicating generational differences in attitudes toward healthcare accessibility.
The stress associated with healthcare costs is notably higher among those without health insurance, who also tend to be more cautious about their safety to avoid medical expenses. Interestingly, 76% of uninsured Americans take extra precautions compared to 65% of those with insurance. Moreover, the willingness to accept care from a lower-reputation provider to save money is higher among the uninsured, with 49% open to it, versus a general reluctance (70%) to compromise on quality for cost savings.
Gen Z stands out as the generation that’s most cautious around spending, challenging the stereotype of their carefree nature. This generation, along with Millennials, shows a heightened interest in therapy, significantly more than Gen Xers and Baby Boomers, unsurprisingly pointing to shifting attitudes toward mental health.
Cost barriers to healthcare access are stark; 42% of Americans have skipped necessary medication due to cost. Another 59% have avoided needed healthcare examination, a figure that rises to 80% among those without health insurance. Regular healthcare practices, like annual physicals and dental visits, are also impacted by insurance status and cost concerns. Surprisingly, annual income levels do not significantly impact spending, indicating a widespread concern across all income brackets.
When considering hypothetical financial windfalls, Americans’ preferences further reflect their priorities and values. Given $1,000, the overwhelming choice would be a vacation over cosmetic enhancements, although a small percentage (11%) would opt for the latter.
It’s evident that Americans are grappling with a range of challenges and concerns when it comes to accessing and affording healthcare. From the disparities in individual out-of-pocket expenses across states to the profound impact of insurance status on healthcare behaviors and stress levels, there are several perspectives to the conversation.
Whether it’s advocating for victims of medical malpractice or helping navigate the complexities of insurance claims, Weiss & Paarz serves as allies in the fight for justice and equitable healthcare access.
To perform our analysis of healthcare spending across the U.S., we conducted a nationwide survey of over 2,100 participants. We asked anonymous respondents to report on their typical healthcare spending, as well as their general thoughts and feelings. The following states were omitted from our report due to insufficient sample sizes: Alaska, Montana, North Dakota, South Dakota, Vermont, and Wyoming.
Disclaimer: The historical information and specific statistics displayed above are solely designed to provide general knowledge to the public and are being used as a part of attorney marketing. Cited statistics and statements were taken from the research of various independent websites (referenced below). Weiss & Paarz did not take any steps to replicate the findings of any sources used in this infographic, nor were the numbers or results displayed above independently verified by Weiss & Paarz.
Call 1-800-952-8444