Need Help? Call Now
1-800-952-8444Free Consultation
Need Help? Call Now
1-800-952-8444Posted on October 06, 2021

At Weiss & Paarz, by focusing our practice area exclusively on medical negligence, we’ve developed unique expertise in a wide range of medical malpractice lawsuits. We have found that no matter the similarities across types of injuries, there are always many differences between medical malpractice claims by state. Cases, including those involving catastrophic birth injury and requiring the expertise of birth injury attorneys, to a delayed or missed stroke diagnosis, are always made up of different circumstances and impact individuals and their loved ones in unique, varied ways.
Despite the differences between each individual’s claims, similarities across medical malpractice suits are also common. Medical malpractice and/or negligence happens much more frequently than people realize. Many patients who are victims of preventable medical mistakes are fortunately not significantly impacted, such that filing a lawsuit does not make financial sense and would often take more of a toll on someone emotionally than putting the error behind them. Other victims of preventable medical errors are less lucky and their injuries resulting from medical malpractice create devastating blows to their health, their ability to earn income, and their families. To better understand medical malpractice and how it impacts Americans on a broader scale, we reviewed the recent history of medical malpractice claims in every state nationwide.
Our marketing team reviewed 30 years of data relating to medical malpractice suits across the USA collected by the U.S. Department of Health and Human Resources. This agency maintains a National Practitioner Data Bank that collects data on the number of successful malpractice suits in every state as well as the total sum of money awarded in those lawsuits. The data spans decades as far back as 1990 through more current data which covers lawsuits settled as recently as September 2020. Our marketing team analyzed this comprehensive medical malpractice data to better understand medical malpractice trends across states from coast to coast. Our team also highlighted noteworthy data from 2019’s medical malpractice lawsuits (the most recent full year with data available) in order to capture a current snapshot of medical malpractice in the United States. Read on for our ultimate analysis of the last three decades of medical malpractice suits across the United States.
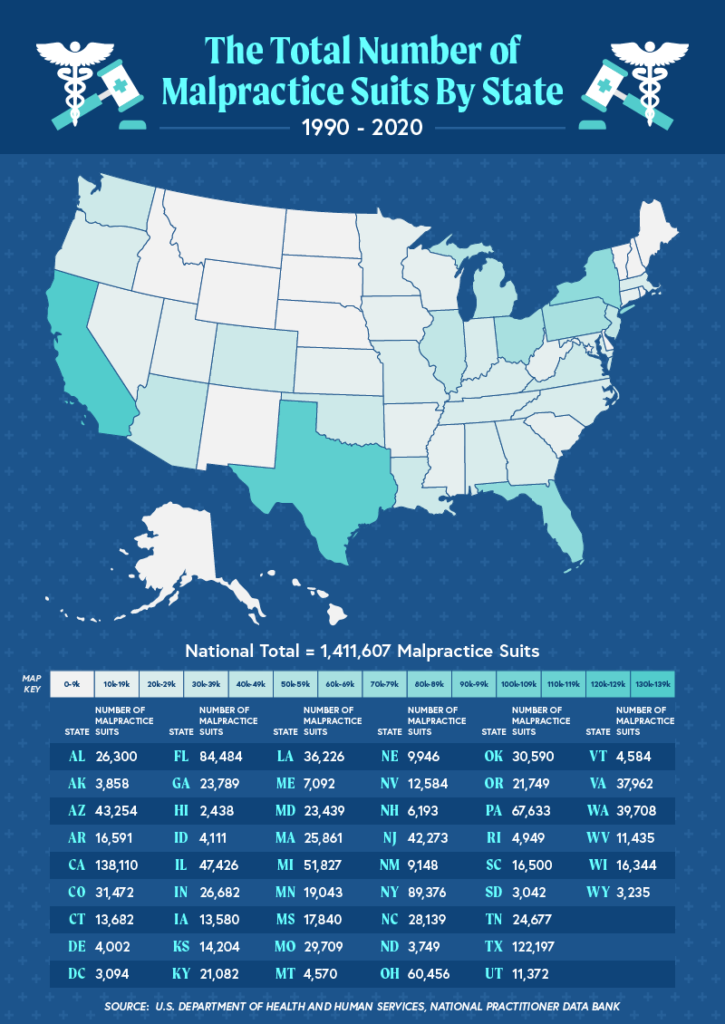
First, our team reviewed the total number of medical malpractice suits filed in America between 1990 and 2020. Over the past 30 years, a total of 1.41 million cases have been filed involving various medical malpractice claims. This averages out to about 47,000 cases a year. For those who thought medical malpractice was an issue impacting very few Americans, these numbers may lead you to believe otherwise.
The states with the most medical malpractice suits over the past 30 years include California (138,110), Texas (122,197), and New York (89,376). These are all among the most populated states in America, so it makes sense that they would present with a statistically higher volume of medical malpractice claims.
On the other hand, the states with the fewest medical malpractice suits filed between 1990 and 2020 included Washington, D.C. (3,094), South Dakota (3,042), and Hawaii (2,438). Like the bigger populations presenting with the highest volume of claims, it makes sense for states with smaller populations to present with fewer medical malpractice claims.
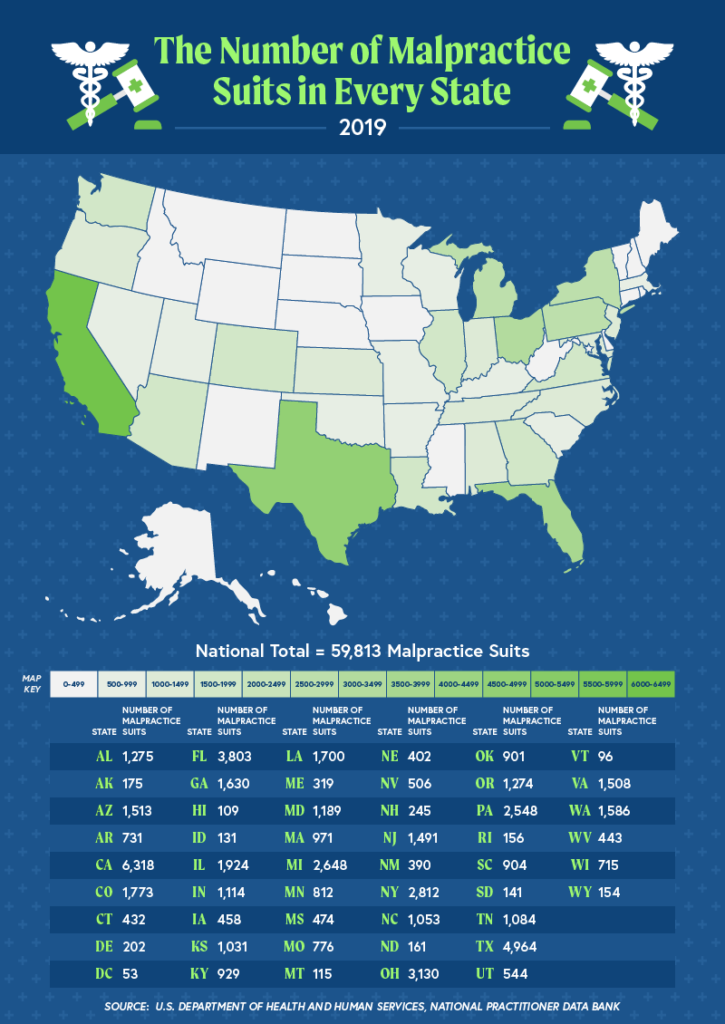
To examine more recent trends in medical malpractice cases nationwide, our marketing team took a closer look at the state-by-state total medical malpractice suits filed in 2019. Our team found that the total number of medical malpractice suits filed in 2019 (59,813) exceeded the average number of suits filed each year between 1990 and 2020.
While California (6,318 suits) and Texas (4,964 suits) remained in the top three states for medical malpractice suits throughout 2019, Florida came in above New York with 3,803 medical malpractice suits filed. California’s suits made up over 10% of the national total malpractice suits filed.
At the lower end of things, the states with the fewest malpractice suits filed in 2019 were Washington D.C. (53), Vermont (960), and Hawaii (109).
Having looked at the total number of malpractice suits by state, our team also decided to highlight the realized malpractice payouts over the years. These payouts help victims move on and adapt their lives to new realities following catastrophic and life-altering injuries.
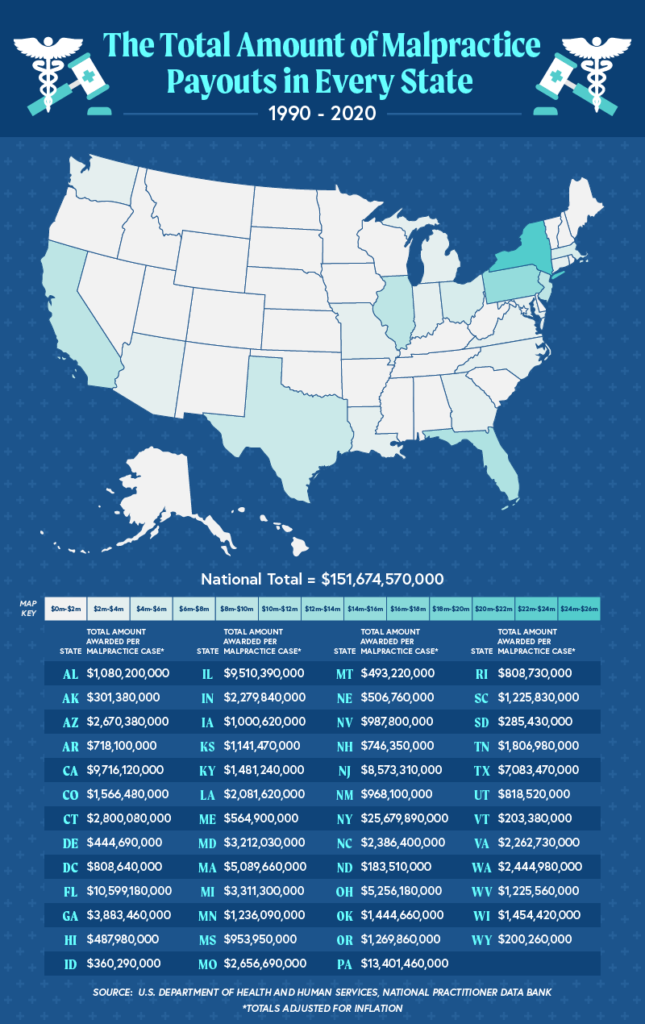
First, we looked at the total medical malpractice compensation award totals by the state over the past 30 years. Across the country, medical malpractice claim awards totaled around $151.7 billion from 1990 to 2020.
The states with the largest medical malpractice compensation award totals included New York ($25.7 billion), Pennsylvania ($13.4 billion), and Florida ($10.6 billion). Conversely, the states with the lowest total compensation awards arising from medical malpractice suits over the past 30 years included North Dakota ($183.5 million), Wyoming ($200.3 million), and Vermont ($203.4 million).
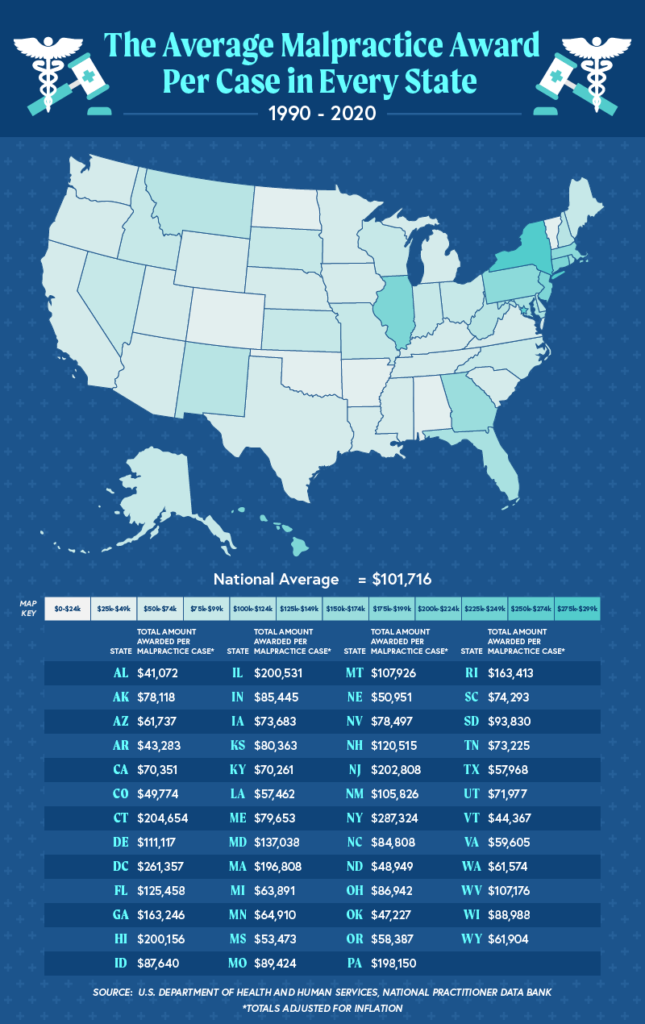
Having looked at the total medical malpractice awards paid out by the state, our team then reviewed data relating to the average medical malpractice award per case. This approach to the data reduced the influence of population size on the total payouts across states.
The national average medical malpractice award per case over the past 30 years amounts to $101,716.
Some states far exceeded that national average. In New York, for instance, the average medical malpractice award per case was $287,324 and in Washington D.C., the average award was $261,357. Other states, like Alabama ($41,072), Arkansas ($43,283), and Vermont ($44,367) present with a significantly lower average compensatory amount awarded throughout medical malpractice claims filed over the past 30 years.
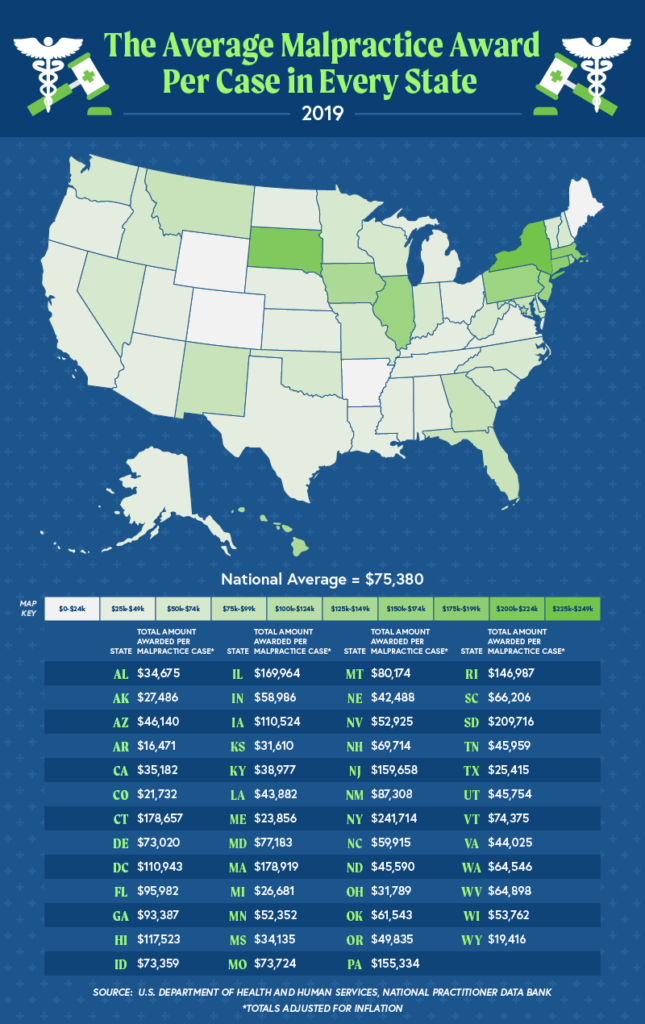
Our marketing team also reviewed the average number of medical malpractice awards per case in 2019 alone, noting an average award of $75,380, which was significantly lower than the average award per case between 1990 and 2020.
The top states for average malpractice awards per case in 2019 were New York ($241,714), South Dakota ($209,716), and Massachusetts ($178,919). Notably, South Dakota jumped from being eighteenth in average malpractice award totals in the overall 30-year period of data reviewed to the top-three list in 2019. The states with the lowest average medical malpractice awards per case in 2019 were Arkansas ($16,741), Wyoming ($19,416), and Colorado ($21,732).
The data reviewed reaffirms how important our mission is here at Weiss and Paarz, and how necessary a checks and balances system has become to our increasingly large and complex healthcare system. If you or a loved one believe they have suffered significant permanent injuries resulting from preventable medical mistakes, contact our specialized team for a case evaluation. Note we do not charge our clients any fees unless we file their lawsuit and successfully obtain a recovery on their behalf. Learn more about our contingency policy here.
Disclaimer: The historical information and specific statistics displayed above are solely designed to provide general knowledge to the public and are being used as a part of attorney marketing. Cited statistics and statements were taken from the research of various independent websites (referenced below). Weiss & Paarz did not take any steps to replicate the findings of any sources used in this infographic, nor were the numbers or results displayed above independently verified by Weiss & Paarz.
Call 1-800-952-8444